Server monitoring using munin + additional Apache monitoring and WordPress coexistence
Server monitoring is indispensable for stable server operation. However, it is impossible to keep watching the server 24 hours a day, so we use "munin", "aws admin panel" and "pingdom" to monitor the server.
- munin - Server and network monitoring tools. Open source.
- awsmanagement screen - to check the status of various resources.
- pingdom - A service that checks for life and death from data centers around the world.
This article describes how to use munin to monitor Apache, and some notes that may occur when you are running Wordpress and other applications.

prerequisite
This article has been tested in the following environment.
- AmazonLinux from Amazon Web Services, with Apache 2.4 already installed
Installation of Munin
Munin can be installed by following the steps below.
sudo yum install munin munin-node # installation
sudo chkconfig munin-node on Configure # service to start automatically
sudo service munin-node start Start the # service
sudo htpasswd -c /etc/munin/munin-htpasswd admin Set the # password
Now, after about 5 minutes, you can see the server monitoring results in /munin/.
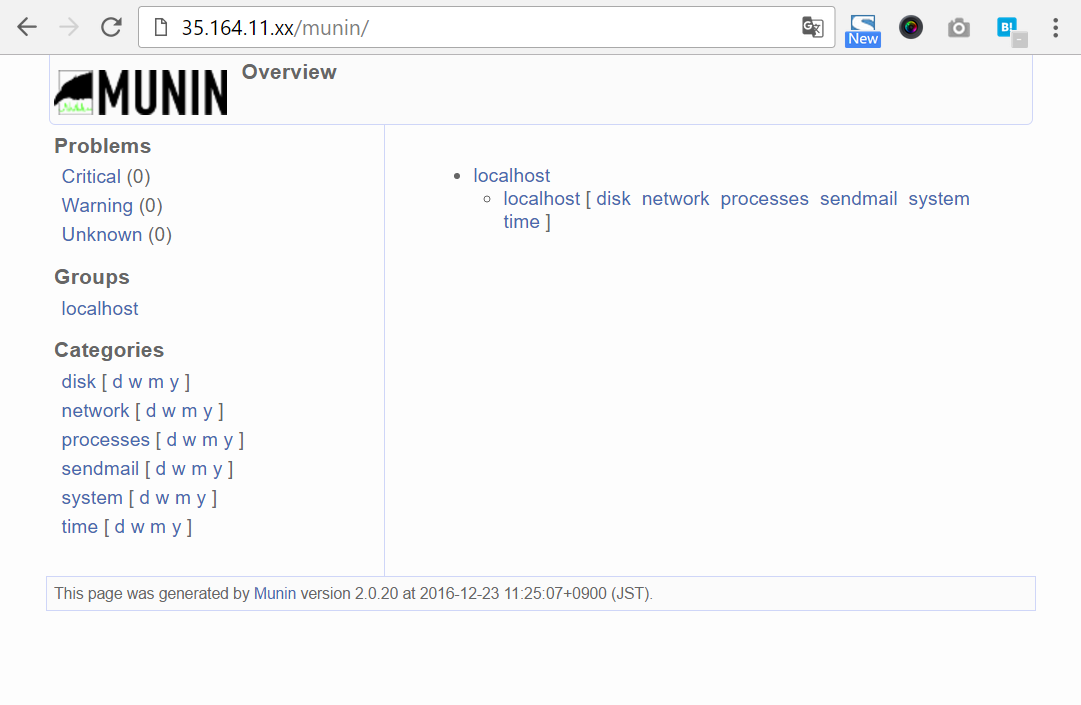
If the monitoring result does not exist, the following screen will be displayed. (Only when the directory index (=list of files in the directory) is allowed)

When the monitoring result is generated, the following screen is displayed.
Now you can use munin, but the password you just set is ignored and anyone can see the monitoring results. This is a security problem. (The attacker will know your weakness.)
Restarting Apache
Restarting Apache will enable Munin's login restriction. This completes the basic configuration for basic server monitoring using munin.
sudo service httpd restart
Additional monitoring items
Even with just a basic setup, you can now get pretty detailed information about your server. Many of the things you need to worry about at the OS level like disk, network, CPU, etc. are covered.
In version 2.0.20, 38 monitoring items are enabled by default (some of them monitor about 10 values within a single item), but overall 232 monitoring items are prepared.
You may think that you should add all of them, but it is not recommended. If you do so, it will cause a load for monitoring, extra space for saving the monitoring result, and unnecessary items will be listed on the screen of munin, and it will be difficult to find the desired item.
Monitoring items enabled by default
ls /etc/munin/plugins/
cpu diskstats fw_packets interrupts memory ntp_kernel_pll_freq ntp_states processes sendmail_mailstats threads vmstat
df entropy if_err_eth0 irqstats netstat ntp_kernel_pll_off open_files proc_pri sendmail_mailtraffic uptime
df_inode forks if_eth0 load ntp_kernel_err ntp_offset open_inodes sendmail_mailqueue swap users
Ready-to-use monitoring items just by linking
ls /usr/share/munin/plugins/
acpi diskstat_ ip_ nfs4_client postgres_checkpoints snmp__cpuload snort_traffic
amavis diskstats ipac-ng nfs_client postgres_connections_ snmp__df spamstats
apache_accesses ejabberd_ ipmi_ nfsd postgres_connections_db snmp__df_ram squeezebox_
apache_processes entropy ipmi_sensor_ nfsd4 postgres_locks_ snmp__fc_if_ squid_cache
apache_volume exim_mailqueue ircu nginx_request postgres_oldest_prepared_xact_ snmp__fc_if_err_ squid_icp
apc_envunit_ exim_mailqueue_alt irqstats nginx_status postgres_prepared_xacts_ snmp__if_ squid_objectsize
apc_nis exim_mailstats jmx_tomcat_dbpools nomadix_users_ postgres_querylength_ snmp__if_err_ squid_requests
apt fail2ban load ntp_kernel_err postgres_scans_ snmp__if_multi squid_traffic
apt_all files_ loggrep ntp_kernel_pll_freq postgres_size_ snmp__load surfboard
asterisk_channels foldingathome lpar_cpu ntp_kernel_pll_off postgres_streaming_ snmp__memory swap
asterisk_channelstypes foldingathome_rank lpstat ntp_offset postgres_transactions_ snmp__netapp_diskusage_ tcp
asterisk_codecs foldingathome_wu mailman ntp_states postgres_tuples_ snmp__netapp_inodeusage_ threads
asterisk_meetme forks mailscanner nut_misc postgres_users snmp__netstat tomcat_access
asterisk_meetmeusers freeradius_acct mbmon_ nutups_ postgres_xlog snmp__print_pages tomcat_jvm
asterisk_sipchannels freeradius_auth memcached_ nut_volts proc snmp__print_supplies tomcat_threads
asterisk_sippeers freeradius_proxy_acct meminfo nvidia_ processes snmp__processes tomcat_volume
asterisk_voicemail freeradius_proxy_auth memory open_files proc_pri snmp__rdp_users uptime
bind9 fw_conntrack mhttping open_inodes proxy_plugin snmp__sensors_fsc_bx_fan users
bind9_rndc fw_forwarded_local multiping openvpn ps_ snmp__sensors_fsc_bx_temp varnish_
bonding_err_ fw_packets multips perdition psu_ snmp__sensors_fsc_fan vlan_
buddyinfo haproxy_ multips_memory pgbouncer_connections qmailqstat snmp__sensors_fsc_temp vlan_inetuse_
cmc_tc_sensor_ haproxy_ng munin_stats pgbouncer_requests qmailscan snmp__sensors_mbm_fan vlan_linkuse_
courier_ hddtemp munin_update ping_ qmailscan-simple snmp__sensors_mbm_temp vmstat
courier_mta_mailqueue hddtemp2 mysql_ plugin.sh quota_usage_ snmp__sensors_mbm_volt vserver_cpu_
courier_mta_mailstats hddtempd mysql_bytes plugins.history samba snmp__swap vserver_loadavg
courier_mta_mailvolume hddtemp_smartctl mysql_innodb pm3users_ selinux_avcstat snmp__uptime vserver_resources
cps_ hp2000_ mysql_isam_space_ pop_stats sendmail_mailqueue snmp__users yum
cpu http_loadtime mysql_queries port_ sendmail_mailstats snmp__winload zimbra_
cpuspeed if_ mysql_slowqueries postfix_mailqueue sendmail_mailtraffic snmp__winmem
cupsys_pages if_err_ mysql_threads postfix_mailstats sensors_ snort_alerts
df ifx_concurrent_sessions_ named postfix_mailvolume slapd_ snort_bytes_pkt
df_abs interrupts netopia postgres_autovacuum slapd_bdb_cache_ snort_drop_rate
df_inode iostat netstat postgres_bgwriter slony_lag_ snort_pattern_match
digitemp_ iostat_ios netstat_multi postgres_cache_ smart_ snort_pkts
Added monitoring items for Apache
Now, let's add some monitoring items related to Apache.
You can set it up in the following 3 steps. (If you don't have Wordpress, it's often 2 steps)
- Enabling Extended Status Display in Apache
- If .htaccess is misbehaving, fix the description (only if necessary)
- Add a monitoring target to munin
Enabling Extended Status Display in Apache
Add the following configuration to the end of /etc/httpd/conf/httpd.conf. When /server-status is accessed, it is specified to be handled by the server-status handler. In addition, because there is a security problem when it is possible to access it from the outside, I only permit access from the local host.
SetHandler server-status
Order Deny,Allow
Deny from all
Allow from localhost
</Location
Allow from localhost is used for access from munin.
Now, if you can access /server-status and get the server status, you are good to go.
Since access from the outside is not permitted, confirm whether it is possible to access it by using wget http://localhost/server-status.
If you have a CMS such as Wordpress, fix the .htaccess of it because it may be doing something wrong.
Modify the .htaccess (only if necessary)
In /var/www/html/.htaccess, there is a URL rewrite setting, and that setting may be misbehaving. By adding "RewriteCond %{REQUEST_URI} ! =/server-status" to exclude server status acquisition URLs from rewriting.
# BEGIN WordPress
<IfModule mod_rewrite.c
RewriteEngine On
RewriteBase /
RewriteRule ^index\.php$ - [L].
RewriteCond %{REQUEST_FILENAME} ! -f
RewriteCond %{REQUEST_FILENAME} ! -d
RewriteCond %{REQUEST_URI} ! =/server-status
RewriteRule . /index.php [L].
Add a monitoring target to munin
You can put a symbolic link to it. You can add Apache related monitoring items by copying and pasting the following.
sudo ln -s /usr/share/munin/plugins/apache_accesses /etc/munin/plugins/apache_accesses
sudo ln -s /usr/share/munin/plugins/apache_processes /etc/munin/plugins/apache_processes
sudo ln -s /usr/share/munin/plugins/apache_volume /etc/munin/plugins/apache_volume
Be sure to restart munin-node after adding a symbolic link.
service munin-node restart
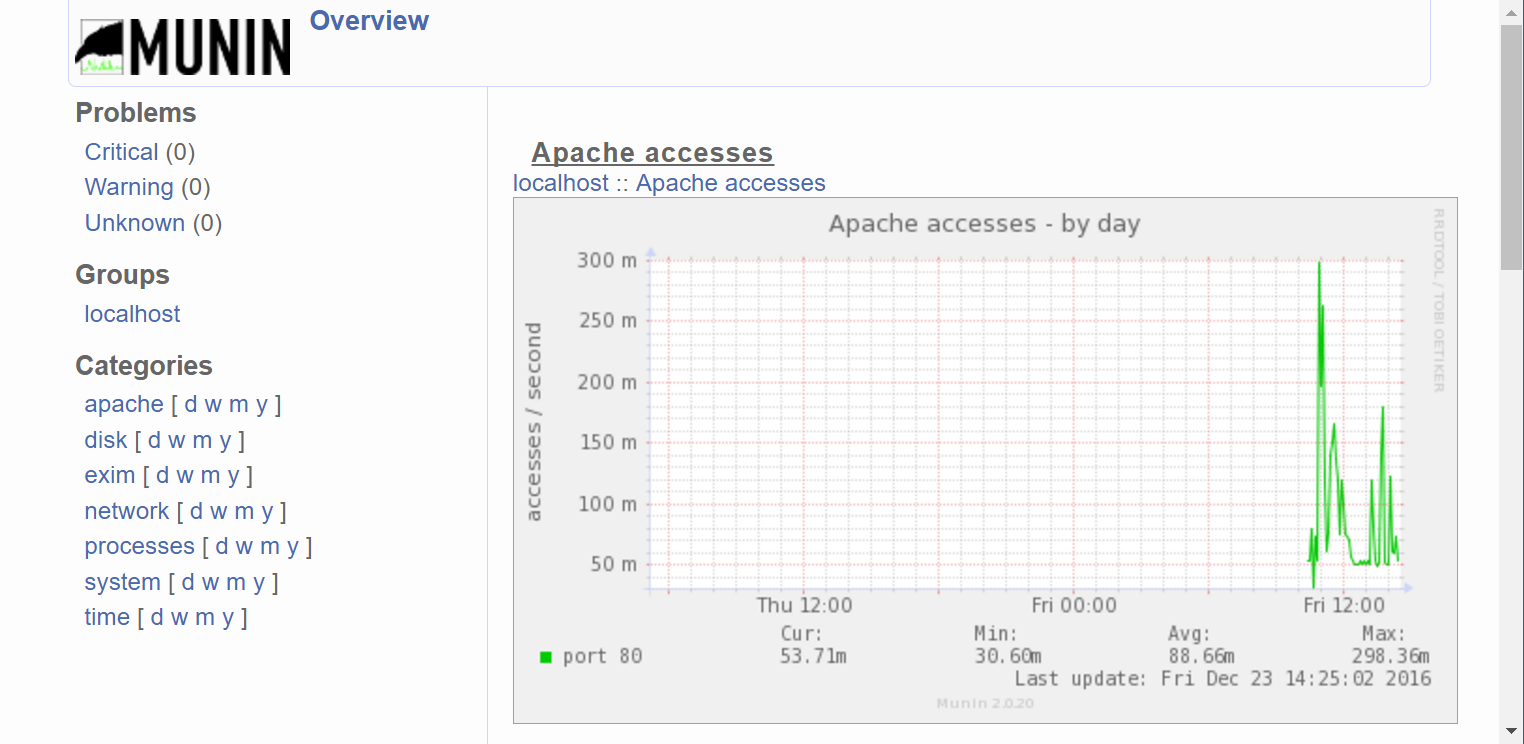
If the configuration is successful, the apache item will be added and the graph will begin to be drawn.
Summary
Using munin, you can easily start server monitoring. In this example, we specified additional monitoring for Apache, but you can add the appropriate plugins as needed to build a practical server monitoring system.